
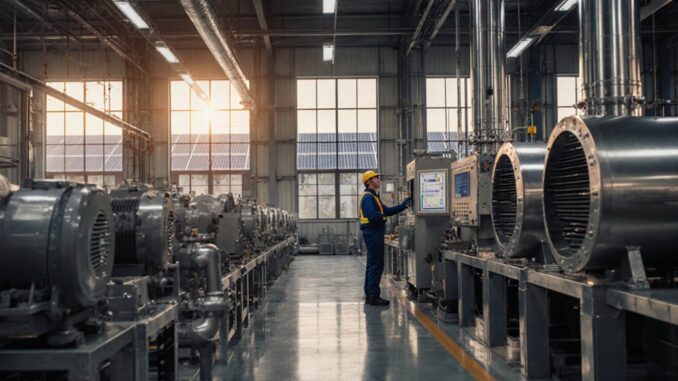
German factories are improving efficiency by auditing electricity, gas, steam, compressed-air, and process loads to establish normalized baselines. They rank projects by verified savings, peak-demand effects, cost, and operational risk. Upgrades include high-efficiency motors, variable-speed drives, leak repairs, insulation, condensate recovery, and waste-heat reuse. Digital energy-management systems use interval meters, production data, and AI anomaly detection to identify losses. On-site solar offsets daytime grid purchases. The following sections explain how these measures are prioritized and verified.
Why German Factories Need Energy Efficiency
German factories need energy efficiency because energy-intensive manufacturing remains highly exposed to electricity, natural gas, and carbon-cost volatility. Industrial sites depend on interconnected loads—motors, compressed-air systems, process heat, refrigeration, and ventilation—whose cumulative demand directly affects unit production costs and competitiveness. Even modest reductions in kilowatt-hours per tonne can materially improve margins in chemicals, metals, paper, food processing, and automotive supply chains.
Efficiency also strengthens operational resilience. Lower peak demand reduces exposure to grid-price spikes, while optimized thermal processes can limit fuel consumption and emissions simultaneously. This matters under the EU Emissions Trading System, German energy-tax rules, and sector-specific reporting requirements. Factories must reduce operating costs while maintaining throughput, product quality, and equipment availability.
System-level efficiency supports decarbonization without requiring immediate full electrification or production redesign. It can lower baseline consumption, improve energy-intensity metrics, and help facilities meet stringent regulations as reporting, carbon pricing, and climate-performance expectations increase.
Start With a Factory Energy Audit
A factory energy audit establishes a measured baseline by mapping electricity, gas, compressed-air, and thermal demand across equipment, production lines, and operating periods. Interval data and load profiles reveal peak-demand drivers, idle consumption, process losses, and abnormal energy intensity. These findings prioritize efficiency measures according to verified savings potential, capital cost, and operational impact.
Map Energy Consumption
Before efficiency measures can be prioritized, a factory energy audit should establish a verified baseline across electricity, natural gas, compressed air, steam, heating, cooling, and process loads. Meter readings, utility invoices, production records, and building-management data should be reconciled by time interval, production line, and operating condition. Energy baseline mapping then allocates consumption to defined system boundaries, distinguishing fixed loads from throughput-dependent demand. Submetering should capture peak demand, load factor, temperature effects, and idle-period consumption. Data quality checks should identify missing intervals, inconsistent units, and unaccounted energy balances between supply and end use. Sankey diagram insights can visualize energy flows from incoming fuels and power to conversion equipment, distribution networks, and final loads. The resulting map provides a traceable, normalized representation of energy use, expressed per unit produced, operating hour, or conditioned floor area.
Identify Efficiency Opportunities
With the energy baseline established, a factory energy audit can rank efficiency opportunities by quantified savings, implementation cost, operational risk, and interaction with connected systems. Auditors compare measured specific energy consumption against sectoral reference values through process benchmarking, separating unavoidable thermal loads from controllable losses. Meter data, production schedules, and equipment condition records identify compressed-air leakage, oversized motors, idle-time consumption, and unstable control loops.
Priority measures often combine heat integration, such as recovering compressor or furnace waste heat for process water, with targeted HVAC tuning based on occupancy, weather, and production loads. Lighting optimization assesses fixture efficacy, daylight availability, control zoning, and maintenance intervals. Each measure is modeled for annual kilowatt-hour reduction, peak-demand effect, carbon impact, payback period, and disruption requirements. The resulting investment list supports phased implementation without compromising throughput, product quality, or safety.
Prioritize Projects by Savings and Payback
Audit findings can be converted into a ranked project list using annual energy savings, implementation cost, and operational impact. Each measure should be assessed by simple payback period, calculated as capital cost divided by annual cost savings. Projects with high verified savings and short payback periods typically form the first implementation tranche.
Rank Projects by Savings
How should German factories sequence efficiency investments once viable measures have been identified? A ranked portfolio should compare annual kWh reduction, peak-demand effects, production criticality, and verified emissions abatement under comparable operating conditions. Measures are then ordered by their contribution to site-level energy-intensity targets, rather than by isolated equipment performance.
- Quantify compressed air leakage through ultrasonic surveys, pressure logging, and compressor-load data; rank repairs by recoverable electricity and network stability.
- Apply heat recovery benchmarking across ovens, compressors, cooling loops, and exhaust streams. Projects should be ranked against recoverable thermal energy, temperature quality, and simultaneous heat demand.
- Screen interactions before implementation. Variable-speed drives, control upgrades, and insulation measures may alter baselines for later projects, requiring recalculated savings to prevent double counting.
This sequencing directs engineering capacity toward the largest measurable reductions while preserving a coherent plant energy model.
Evaluate Payback Periods
Payback evaluation converts the ranked efficiency portfolio into an investment sequence by comparing installed cost against verified annual energy-cost savings under defined production conditions. Teams calculate retrofit costs, including engineering, downtime, commissioning, metering, and maintenance impacts. They estimate energy savings from baseline load profiles, operating hours, electricity and gas tariffs, and expected production variability. Simple payback equals total project cost divided by annual net savings; discounted cash-flow analysis adds energy-price escalation, financing rates, and equipment life. Projects with short payback but high operational disruption may be deferred. Managers assess implementation risks such as integration failures, compressed installation windows, supplier capacity, and uncertain savings persistence. They compare financing options, including internal capital, leasing, German efficiency loans, and performance contracts. The resulting schedule prioritizes reliable, low-risk measures while preserving capital for larger system upgrades.
Use Energy Management Systems to Find Waste
Energy management systems provide German factories with continuous, granular visibility into electricity, gas, compressed-air, and heat consumption across production lines and support equipment. Energy data logging establishes baselines by shift, product batch, weather condition, and operating state, allowing managers to separate unavoidable process demand from avoidable losses.
- Submetering identifies persistent loads during idle periods, including ventilation, lighting, leakage-related compressor runtime, and standby heating.
- Real time anomaly detection compares current demand against expected consumption models. Deviations can flag abnormal steam losses, compressed-air pressure instability, excessive peak demand, or process equipment operating outside scheduled hours.
- Dashboards link energy use to production output, such as kilowatt-hours per unit, cubic metres of gas per tonne, or compressed-air volume per cycle. These indicators expose deteriorating performance before utility costs become visible in monthly invoices.
The resulting data supports targeted investigations, verified corrective actions, and ISO 50001-style continuous improvement. It also produces an auditable record of savings, preventing assumed reductions from being confused with seasonal or output-driven variation.
Upgrade Motors, Drives, and Production Equipment
Once energy data has identified high-load assets, German factories can prioritize upgrades to motors, variable-speed drives, pumps, fans, compressors, and process machinery that consume disproportionate power or operate inefficiently at partial load. Replacement decisions typically compare annual operating hours, measured kilowatt demand, load profile, maintenance history, and expected production throughput rather than relying on nameplate ratings alone.
High efficiency motors reduce electrical losses, particularly in continuously operated conveyor, ventilation, and pumping applications. VFD retrofits allow rotational equipment to match speed to process demand; for centrifugal loads, modest speed reductions can produce substantial power savings under affinity-law relationships. System design remains critical: oversized pumps, throttled valves, restricted ductwork, leaking compressed-air networks, and poor belt alignment can erode equipment-level gains. Factories accordingly combine component replacement with right-sizing, pressure-setpoint optimization, transmission upgrades, and commissioning tests. Verified post-installation measurements establish baseline-adjusted savings, confirm stable process performance, and support investment decisions across similar production lines.
Use AI and Automation to Reduce Energy Use
AI-powered energy monitoring converts machine-level data into real-time visibility of electricity, heat, and compressed-air consumption. Automated demand optimization can shift or modulate flexible loads to reduce peak demand without disrupting production targets. Predictive maintenance systems identify inefficient operating conditions and impending equipment failures before they increase energy use or cause downtime.
AI-Powered Energy Monitoring
German factories are increasingly deploying AI-based energy monitoring systems that integrate smart-meter data, machine telemetry, production schedules, and weather inputs to identify avoidable consumption in real time. These platforms establish equipment-level baselines, normalize loads against output, and flag deviations before they become persistent losses.
- AI anomaly detection compares current demand curves with historical operating patterns, revealing compressed-air leaks, idle motors, abnormal heat loads, and inefficient standby consumption.
- Dashboards translate interval data into production-relevant indicators, including kilowatt-hours per unit, peak-load duration, and energy intensity by line or shift.
- Alerts assign findings to maintenance, engineering, or operations teams, creating auditable workflows for verification and corrective action.
The resulting visibility supports behavioral energy change by connecting operator decisions with measured consumption. Continuous data validation also improves meter accuracy, asset attribution, and the reliability of factory energy-management reporting across sites.
Automated Demand Optimization
Automated demand optimization extends energy monitoring by converting real-time data into control actions across production assets, utilities, and building systems. Algorithms compare load profiles, production schedules, tariff signals, and operating constraints to identify lower-energy operating windows. They can sequence compressors, pumps, ventilation, thermal storage, and noncritical processes to limit peak demand without disrupting throughput or quality targets.
In German factories, control platforms increasingly integrate dynamic pricing data with site-level energy management systems. When wholesale prices or grid charges rise, automated rules defer flexible loads, adjust setpoints, or draw from onsite storage. Demand response participation can similarly reduce consumption during grid stress periods in exchange for financial compensation. Performance is measured through peak-kilowatt reduction, shifted kilowatt-hours, cost per unit produced, and verified production compliance. Human-defined limits retain authority over safety, process stability, and delivery commitments.
Predictive Maintenance Systems
Beyond load scheduling, predictive maintenance reduces energy waste by detecting equipment degradation before it causes inefficient operation or unplanned downtime. German plants combine monitoring sensors with machine-learning models to track vibration, temperature, pressure, motor current, and compressed-air losses across critical assets.
- Sensor streams establish operating baselines and identify deviations linked to friction, misalignment, fouling, or leakage.
- AI models correlate anomalies with energy intensity, prioritizing interventions where declining performance raises kilowatt-hour consumption per unit produced.
- Automated maintenance scheduling coordinates repairs during planned production windows, limiting idle energy, emergency shutdowns, and replacement costs.
This systems approach improves asset availability while preventing inefficient equipment from remaining in service. Integrated with manufacturing-execution and energy-management platforms, predictive alerts support measurable reductions in electricity demand, compressed-air consumption, and heat losses without disrupting throughput or quality targets across multiple production lines.
Recover Waste Heat From Factory Processes
Waste heat recovery targets thermal energy discharged by furnaces, compressors, drying lines, and exhaust systems that would otherwise be lost to the environment. German manufacturers map heat sources by temperature, flow rate, operating hours, and contamination risk before selecting recovery equipment. Plate, shell-and-tube, or air-to-air heat exchangers can transfer usable energy to process water, space heating, preheated combustion air, or incoming materials.
Where temperatures exceed roughly 150°C, systems may Recover Heat through economizers, thermal oil loops, or heat pumps configured for industrial duty. Lower-grade streams can support wash water and building loads, reducing purchased gas or electricity. Waste Recovery projects require controls that match recovered output with variable demand, preventing overheating and maintaining stable production conditions.
For Industrial Boilers, Efficiency Upgrades often include flue-gas economizers and condensers that raise feedwater temperatures and reduce fuel input. Metered heat balances verify savings, while corrosion-resistant materials and filtration protect equipment from particulates, moisture, and chemical residues over time.
Reduce Compressed Air and Steam Losses
Compressed air and steam networks often contain persistent losses that raise energy demand without supporting production output. In German factories, leak rates, pressure instability, failed traps, and poor condensate return can materially increase fuel and electricity consumption. Metering at compressor outlets, distribution branches, and steam headers establishes a loss baseline and identifies deviations by shift or production line.
- Compressed air auditing uses ultrasonic leak detection, flow logging, and pressure profiling to locate leaks, oversized compressors, and inappropriate end uses. Lowering system pressure where feasible reduces compressor power demand.
- Steam trap inspection verifies that traps discharge condensate while preventing live-steam blow-through. Tagged inspection routes and thermal imaging help prioritize failed units with the highest losses.
- Condensate recovery, insulation repairs, and automatic drain maintenance reduce flash-steam losses and water-treatment demand. Continuous monitoring links corrective actions to measured energy savings, enabling maintenance teams to verify results and sustain performance across interconnected utility systems.
Add On-Site Solar and Renewable Power
On suitable factory sites, rooftop photovoltaics, carport arrays, and adjacent ground-mounted systems can offset daytime grid purchases and reduce exposure to wholesale electricity-price volatility. Output should be matched to interval load profiles, roof orientation, shading, structural capacity, and transformer limits. On site solar is most effective where production demand coincides with midday generation, increasing self-consumption and limiting curtailment.
Rooftop integration requires coordinated design of mounting, fire access, cable routing, inverter placement, lightning protection, and roof-maintenance zones. Generation forecasts can feed energy-management systems, allowing flexible loads such as chillers, pumping, thermal storage, and battery charging to follow available Renewable power. Batteries may reduce short-duration peaks and retain surplus generation for later internal use, subject to connection capacity and operational economics. Where export is permitted, grid export arrangements require compliant metering, protection settings, and coordination with the distribution network operator. Portfolio-wide monitoring should distinguish solar yield losses from production-driven demand changes and identify sites with constrained interconnection capacity.
Fund Projects and Verify Energy Savings
Capital allocation should prioritize efficiency measures using standardized business cases that quantify installed cost, expected energy reduction, operating impacts, maintenance requirements, and project-specific risk. German manufacturers increasingly rank proposals by discounted cash flow, marginal abatement cost, and resilience value, rather than simple payback alone.
- ESCO grants and performance contracts can reduce upfront exposure, particularly for compressed-air, heat-recovery, and motor-control upgrades.
- Projects require metering baselines that normalize consumption for production volume, weather, operating hours, and product mix. Submetering should isolate affected loads before commissioning.
- To verify savings, facilities compare post-installation data against adjusted baselines using defined measurement and verification plans. Variances trigger root-cause analysis of controls, utilization, and equipment condition.
Monthly dashboards should connect energy results to financial forecasts and carbon targets. Independent reporting audits strengthen confidence in claimed reductions, support subsidy compliance, and identify measurement gaps. This governance converts efficiency investment from isolated engineering work into a repeatable capital-management process across sites.

The Industry & Manufacturing Editorial Team focuses on Germany’s industrial economy and the technologies transforming production. Coverage includes mechanical engineering, manufacturing, automation, robotics, process industries, supply chains and industrial digitalisation. Particular attention is given to the German Mittelstand, specialised manufacturers and hidden champions that play an important role in global industrial markets.